Defining transparent treasury analytics analysis
Transparent treasury analytics analysis is the practice of combining traditional corporate treasury data with verifiable onchain records to create an immutable audit trail. Unlike generic financial reporting, which often relies on periodic snapshots and internal ERP dashboards, this approach treats treasury operations as public, programmable events. The goal is to move beyond what a treasury holds to proving how those assets are managed in real time.
At its core, this methodology intersects the liquidity management of traditional finance with the transparency of blockchain technology. For organizations managing Real World Assets (RWAs), this means every cash movement, bond issuance, or reserve allocation is recorded on a distributed ledger. This creates a single source of truth that stakeholders—investors, regulators, and auditors—can verify without relying on third-party attestations.
Note: Transparent treasury analytics here refers to verifiable, onchain data streams for RWA treasuries, not just traditional ERP dashboards.
The distinction matters because traditional treasury analytics focuses on optimizing cash flow and mitigating risk within closed systems. Transparent treasury analytics adds a layer of public accountability. It shifts the paradigm from trust-based reporting to proof-based verification, allowing stakeholders to monitor solvency and operational integrity as they happen rather than after the fact.
Tracking onchain credit performance metrics
Transparent treasury analytics analysis requires moving beyond static snapshots to monitor how tokenized RWA treasuries perform in real time. Unlike traditional fixed-income instruments, onchain credit offers continuous visibility into yield accumulation, default probabilities, and liquidity depth. This transparency allows investors to verify that the underlying assets—whether US Treasuries or commercial paper—match the token supply at any given second.
The core of this analysis rests on three interconnected metrics: yield, default rates, and liquidity. Yield tracking must account for the difference between the on-chain token price and the underlying asset's accrual rate. Default rates, often expressed as a probability of loss, are derived from real-time on-chain data and off-chain credit ratings. Liquidity metrics ensure that tokens can be traded without significant slippage, a critical factor for maintaining trust in the tokenized asset.
To visualize these trends, we can look at performance data for relevant RWA tokens or underlying treasury ETFs. This provides a provider-backed view of how these assets behave during market stress or calm periods.
Regulatory bodies like the Federal Reserve emphasize that market monitoring and surveillance rely on this kind of data availability. When transparency is baked into the token standard, it reduces the information asymmetry that often plagues traditional fixed-income markets. By tracking these metrics continuously, investors can make more informed decisions about risk and reward.
Traditional vs. onchain treasury visibility
Treasury management has long relied on batched data feeds. Legacy systems aggregate transactions at the end of the day or week, creating a lag between execution and visibility. This delay forces finance leaders to manage based on historical snapshots rather than real-time liquidity positions.
The onchain model shifts this dynamic by providing transparent treasury analytics analysis through continuous ledger updates. Every transaction is recorded immutably and immediately, allowing teams to see cash flows as they happen. This reduces the risk of blind spots in cross-border payments or volatile asset positions.
The following comparison highlights the structural differences between these two approaches.
| Dimension | Traditional Analytics | Onchain Transparent Analytics |
|---|---|---|
| Data Latency | Batched (daily/weekly) | |
| Data Latency | Real-time (per transaction) | |
| Auditability | Reconciled post-facto | |
| Auditability | Immutable, verifiable ledger | |
| Asset Coverage | Silos (bank accounts separate) | |
| Asset Coverage | Silos (bank accounts separate) | |
| Asset Coverage | Unified across asset classes | |
| Regulatory Reporting | Manual compilation | |
| Regulatory Reporting | Automated via smart contracts |
The strategic advantage lies in speed and accuracy. Traditional methods require significant manual effort to reconcile siloed data, increasing the likelihood of errors. Onchain transparency automates this process, ensuring that the data used for decision-making is both current and consistent across all asset classes.
Setting up the transparent treasury analytics stack
Building a transparent treasury analytics analysis workflow requires moving from raw on-chain data to actionable, auditable insights. This section outlines the practical steps to establish a stack that tracks credit exposure and liquidity in real time.
Start by identifying the primary data sources. Use official blockchain explorers or specialized treasury analyzers like Curinos to pull transaction logs. Ensure the data pipeline captures all wallet interactions, including stablecoin transfers and yield-bearing asset movements. This foundational step ensures the integrity of your transparent treasury analytics analysis.
Raw on-chain data is often noisy. Normalize the data by mapping wallet addresses to known entities and categorizing transactions by type (e.g., operational, investment, debt service). Cleanse the dataset to remove duplicate entries and handle edge cases like failed transactions. This preparation is critical for accurate credit tracking.
To evaluate credit risk, you must correlate treasury holdings with real-time market conditions. Integrate provider-backed widgets for live price data. This allows you to assess the current value of tokenized assets and monitor volatility impacts on the treasury’s liquidity position. Use these feeds to update your internal valuation models automatically.
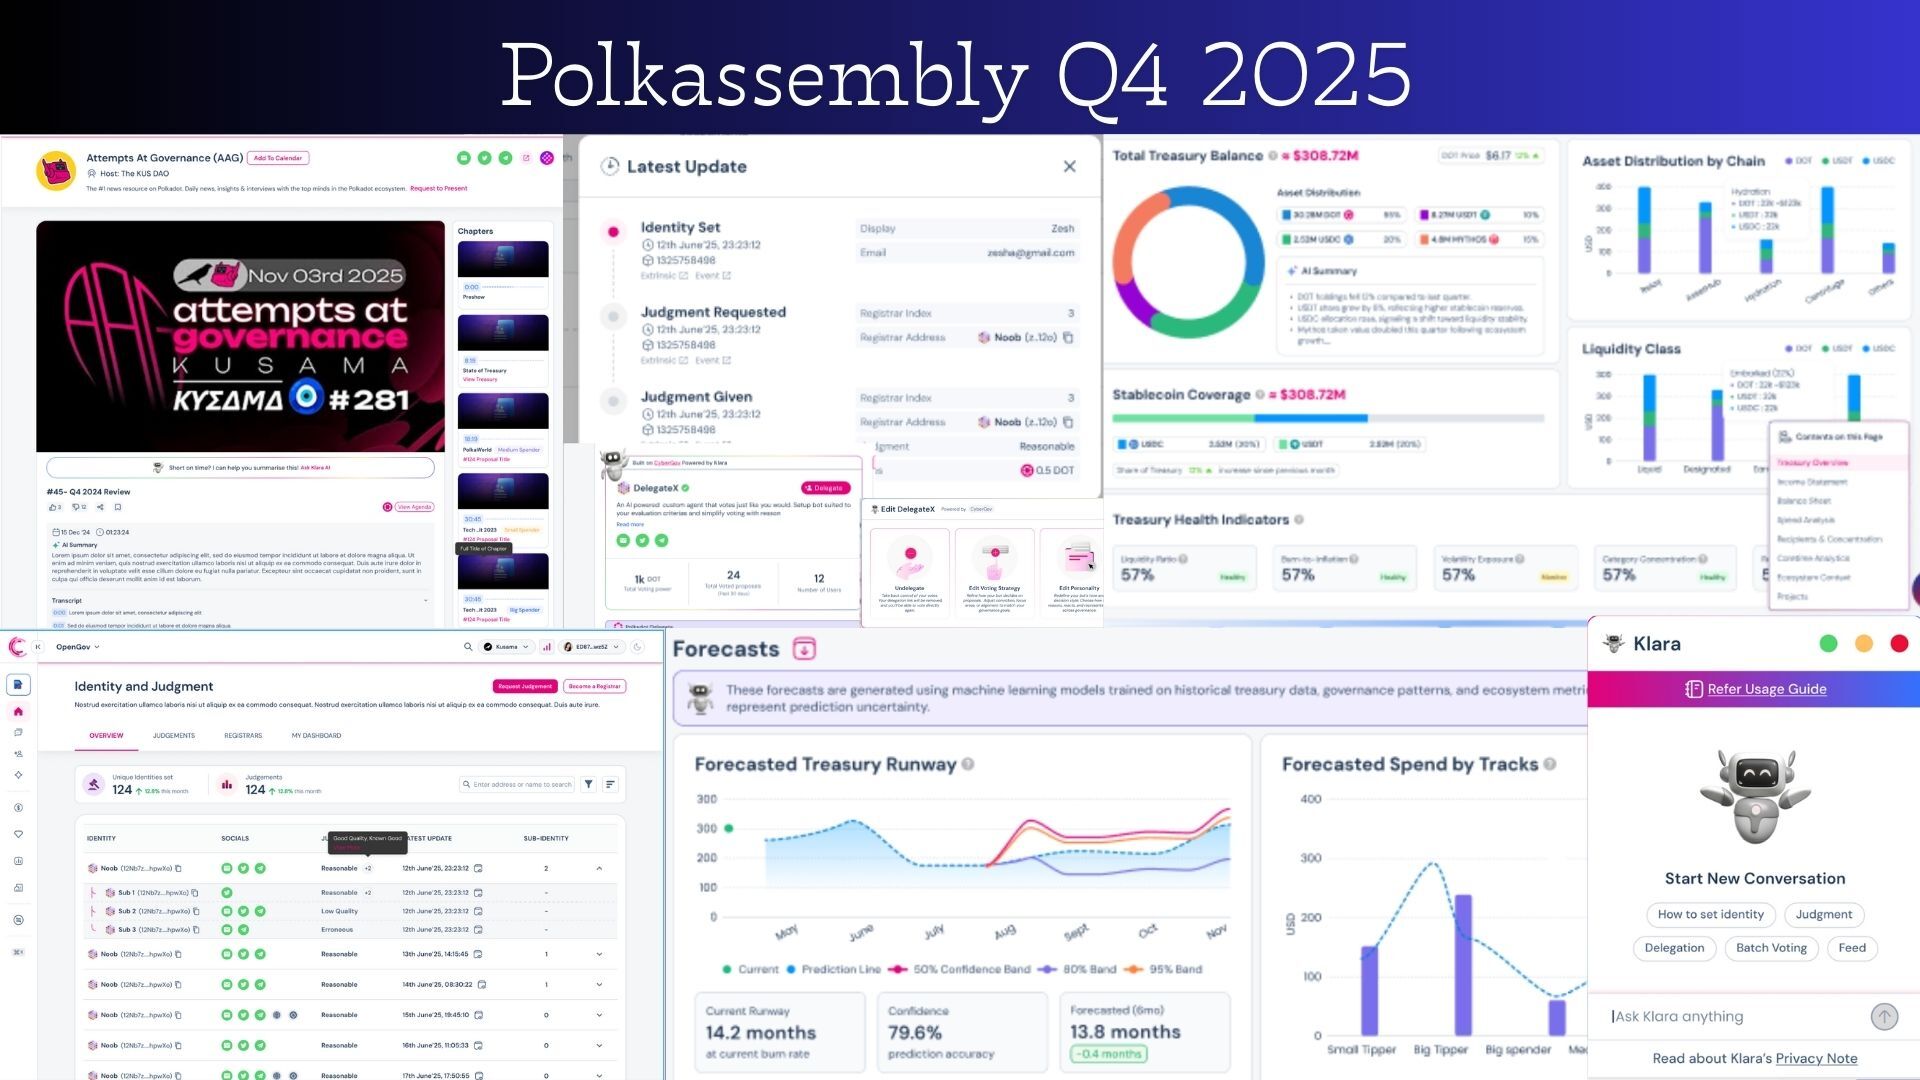
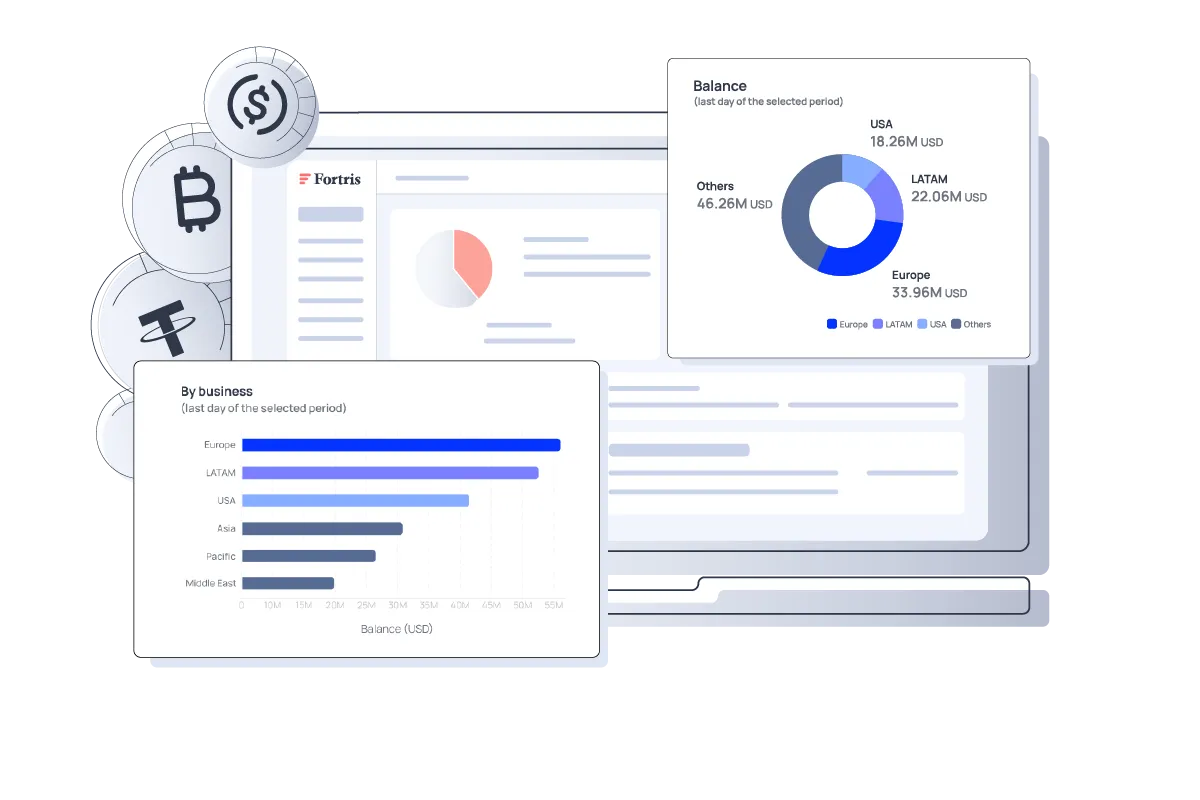
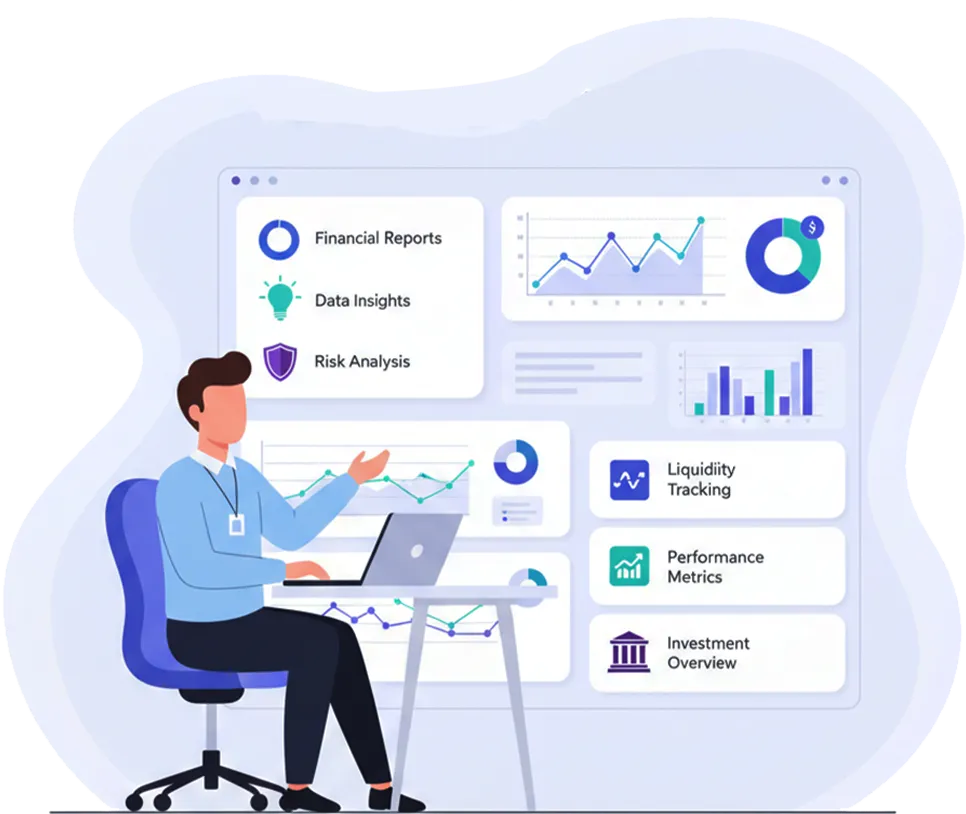
Build dashboards that highlight key metrics: total assets under management, debt-to-equity ratios, and liquid asset coverage. Use visualization tools to create clear, real-time views of the treasury’s health. This transparency allows stakeholders to quickly identify potential liquidity crunches or credit overexposure.
Finally, establish a regular audit cycle. Verify that the automated data feeds are functioning correctly and that the analytics outputs match the source data. This step ensures that your transparent treasury analytics analysis remains reliable and defensible, especially during periods of high market stress.
Common pitfalls in treasury data verification
Verifying onchain treasury data requires more than just reading the blockchain; it demands a critical eye for how offchain realities distort onchain metrics. The most pervasive risk is phantom liquidity, where tokenized real-world assets (RWAs) show high onchain volume but lack corresponding offchain settlement depth. This disconnect can lead to severe mispricing during volatility events, as the onchain order book fails to reflect the true cost of exiting a position.
Another frequent error is ignoring liquidity fragmentation across decentralized exchanges. A treasury holding might appear solvent based on aggregated data, yet face significant slippage if the assets are spread thinly across multiple pools. Without aggregating depth from all relevant venues, analysts may underestimate the friction costs involved in rebalancing or liquidating positions.
Finally, oracle manipulation remains a persistent threat in decentralized finance. Price feeds can be gamed during low-liquidity periods, leading to inaccurate treasury valuations. Relying on a single oracle source without checking for anomalous spikes or divergence from traditional market benchmarks can result in false alarms or missed risks. Always verify price data against established market indicators before making critical treasury decisions.
No comments yet. Be the first to share your thoughts!